
Case study · Commerce profit risk · AI-native

Vigil

Every morning, the operations team knows which products to stop promoting.

A profit-risk monitoring and alerting system built for a commerce team running dozens of WeChat Channels shops. Each day it pulls in every shop's data, flags the products whose returns have crossed the line and sends them to the operations group. Every number on the board opens all the way down to the orders behind it.

Role
Product owner and architect: scoped the problem, designed the system, signed off every release
Timeline
Aug–Sep 2026 · in production within four weeks
Stack
Next.js · TypeScript · PostgreSQL · Docker
Status
In production from September 2026; delivered and archived
AI
Vigil Copilot on DeepSeek: every number in an answer is checked against its source
Demo data
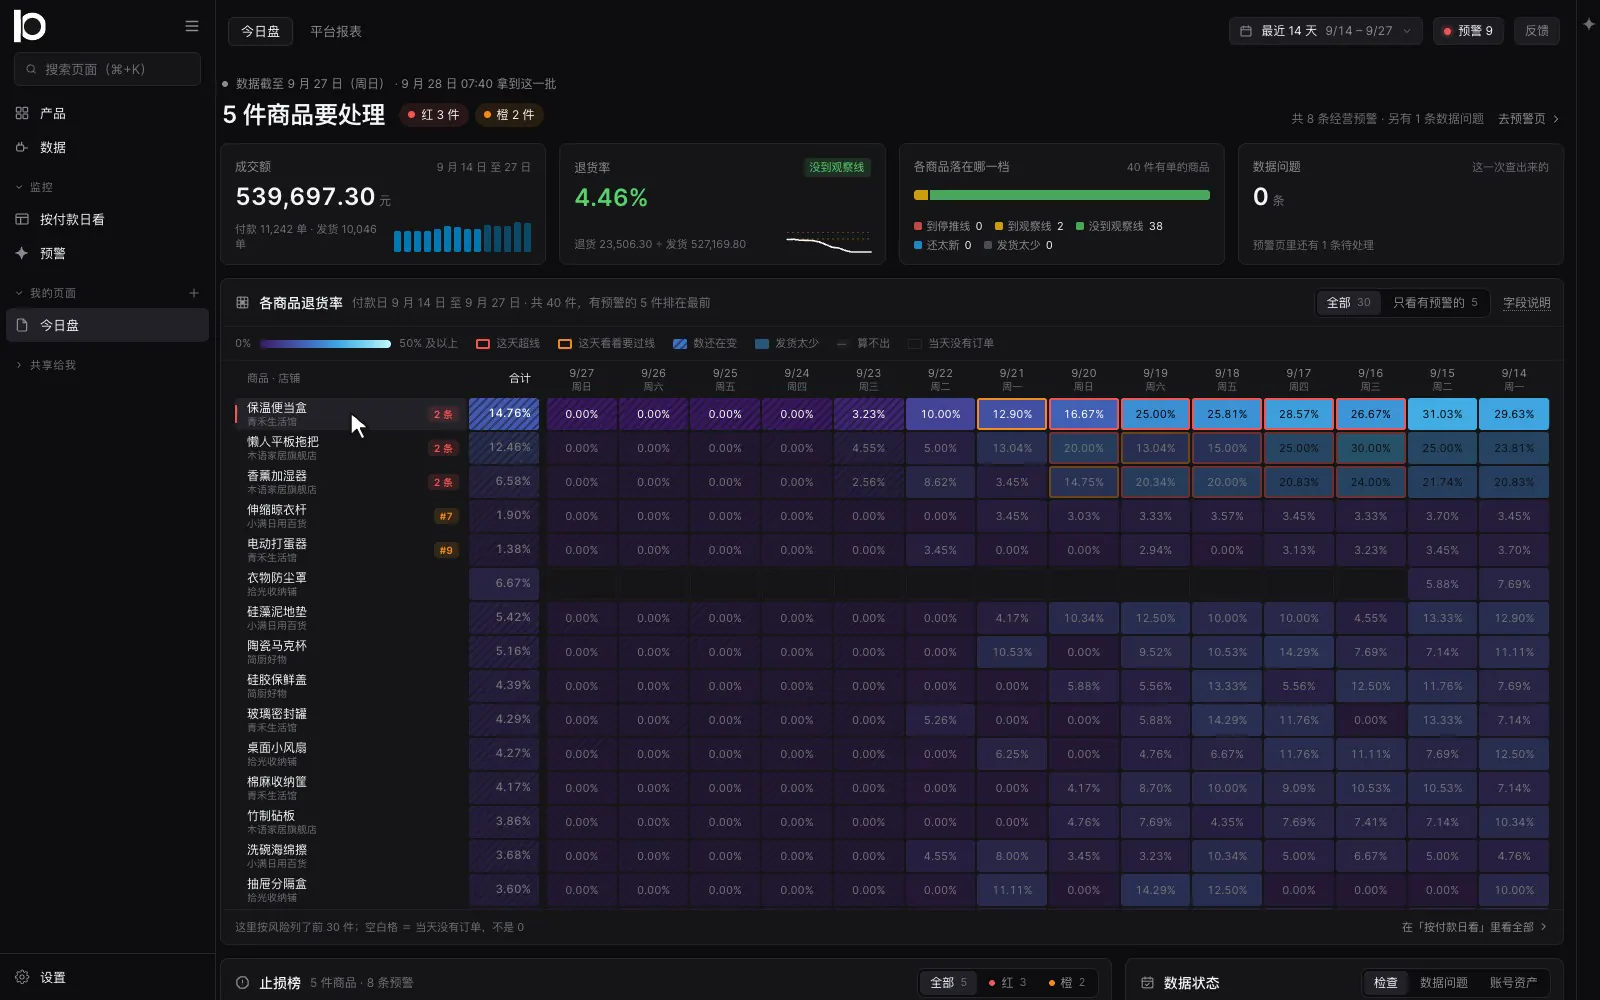
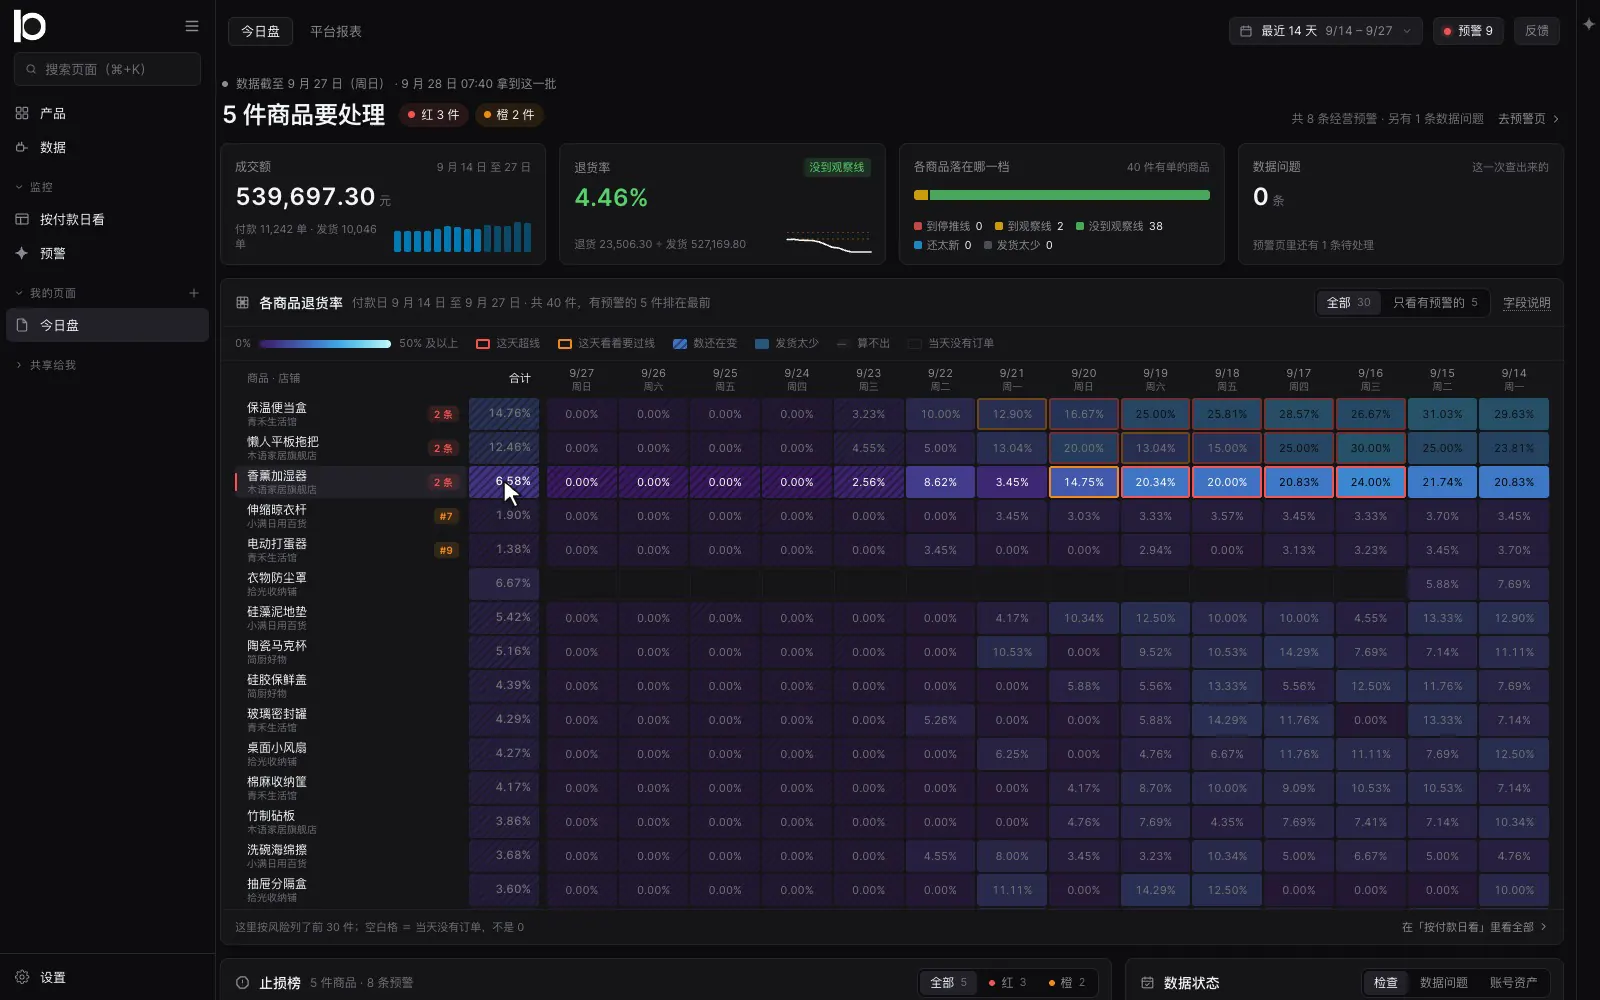
Vigil's Today board: a heatmap of products by pay date, with a cursor sweeping along the three products in red.

Demo data: the real system running a synthetic dataset, screen-recorded from the app.

01 · Background

The team ran dozens of WeChat mini-shops and launched 20–30 products a day. Return data sat in each shop's exports and was pieced together in a group chat, so by the time a product's returns looked wrong, the money was usually gone. Vigil turned that into a daily routine: one data pipeline, one board built to answer which products must stop being promoted today, and alerts that stay open on each product instead of scrolling away.

02 · The problem

The faster a product sells, the better its return rate looks

Returns arrive days after the sale. When a product takes off, a flood of fresh orders that haven't had time to come back lands in the denominator, and the overall return rate drops, right at the stage where a bad product is losing the most money.

Vigil groups orders by pay date and scores each group on its own. A red alert fires only once a pay date is 14 days old and its returns have largely landed; before that, the most it can raise is an early orange warning. Growth can no longer hide a bad product.

One product, two readings

Illustrative modelSlide across the chart to read any day
  • Trailing 14-day return rate
  • Matured pay dates
  • Orders per day
Over 27 days a product's orders ramp from 8 to 120 a day. Its trailing 14-day return rate peaks just under the 10% watch line and then falls as sales take off, while pay dates that have matured sit at 21%, above the 15% stop line.0%5%10%15%20%25%Watch line 10%Stop line 15%6.5%Trailing 14-day return rate21.0%Matured pay datesDay 0Day 7Day 14Day 21Days since launch
Illustrative model, using the same sales ramp and return-delay distribution as the demo dataset.
Demo data
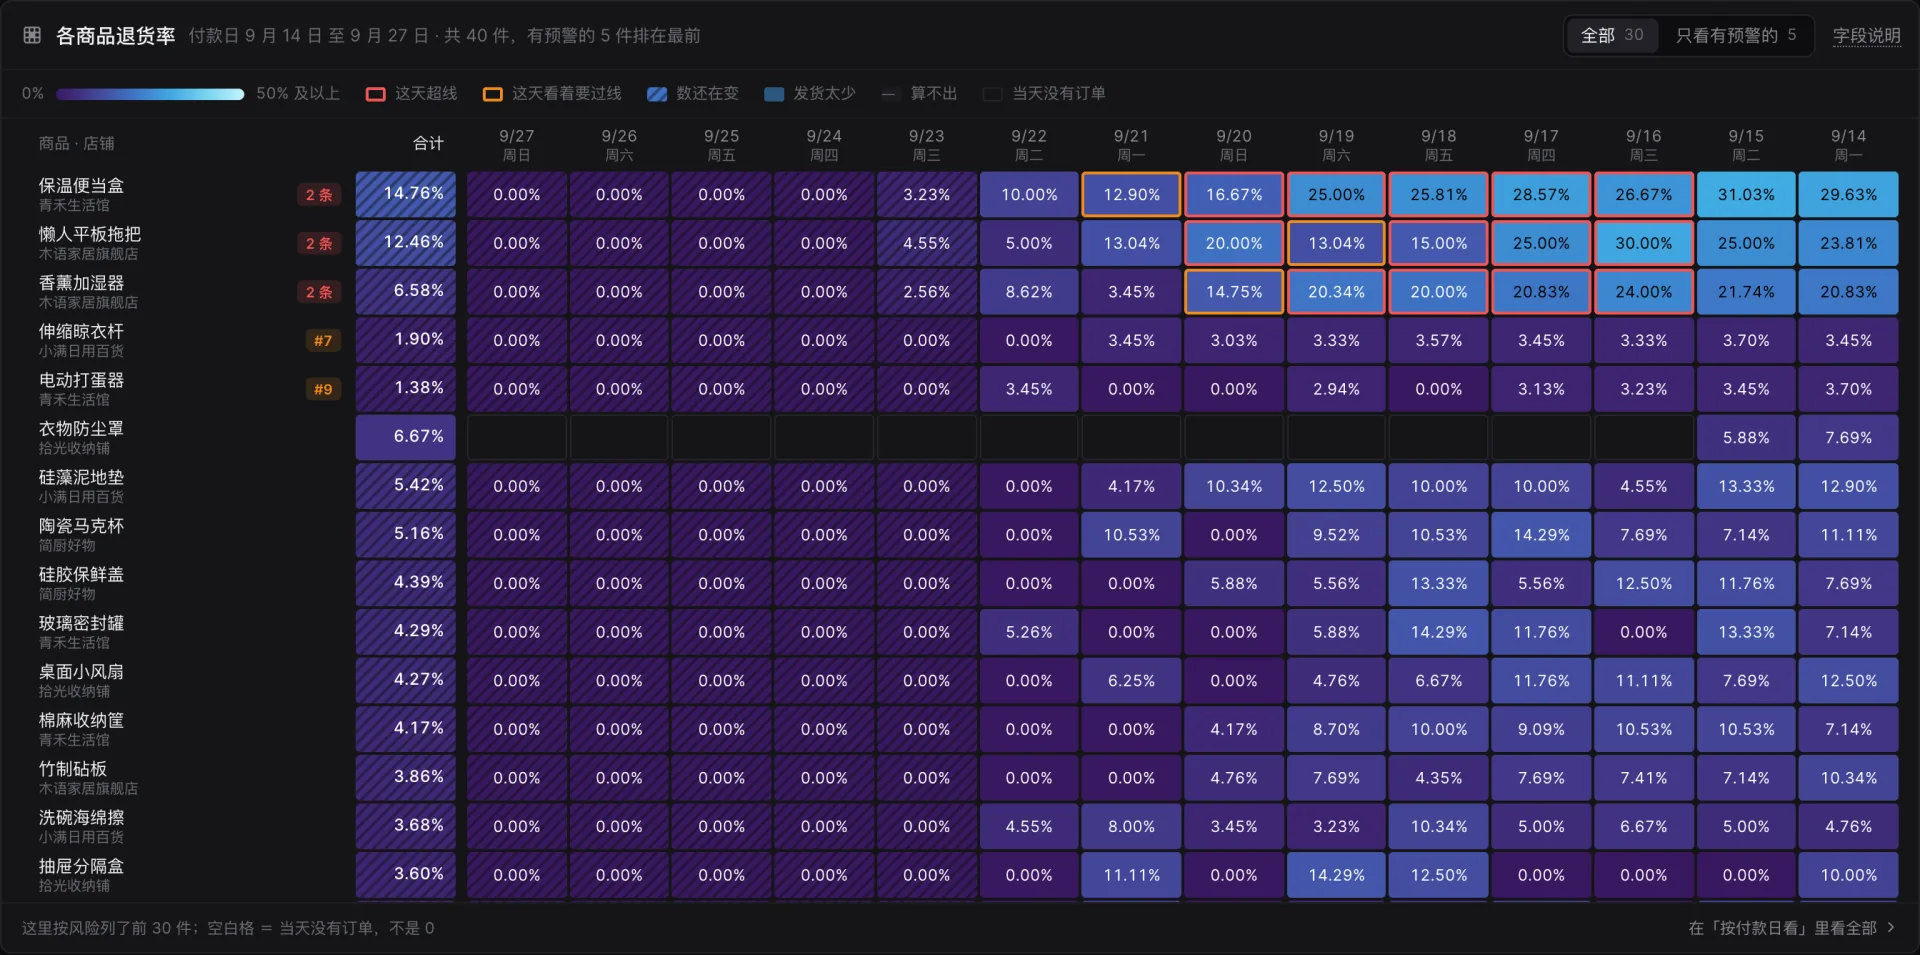
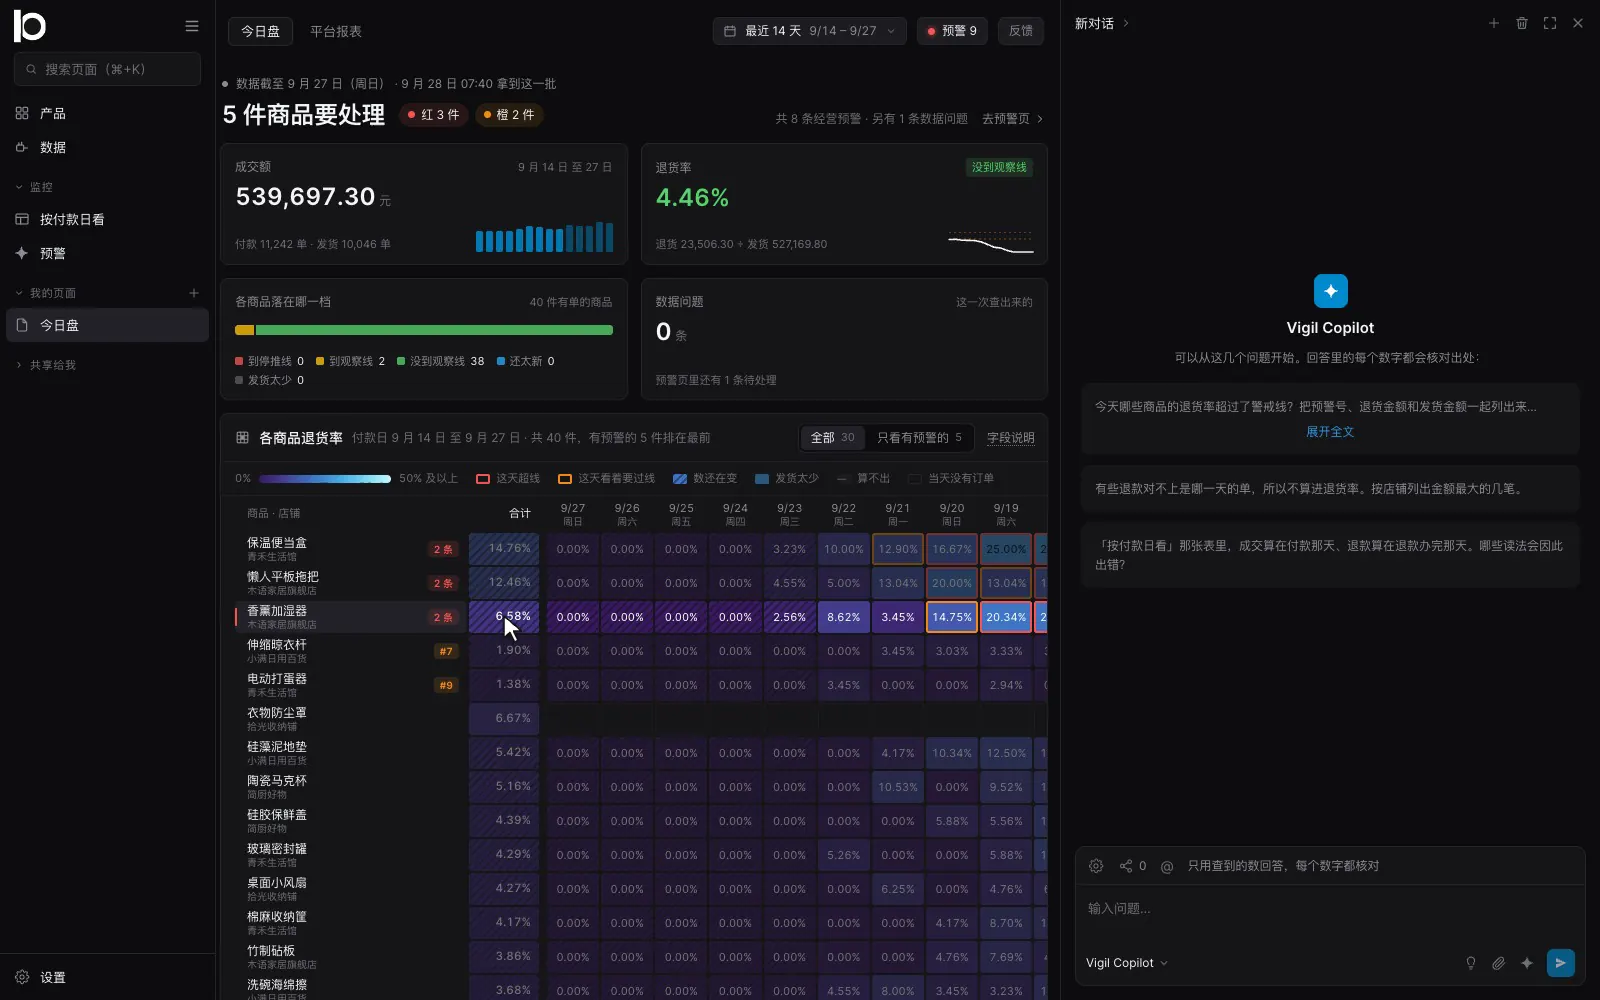
Vigil's return-rate heatmap for the last 14 days: 30 products by pay date, recent days striped as still moving, days over the line outlined.
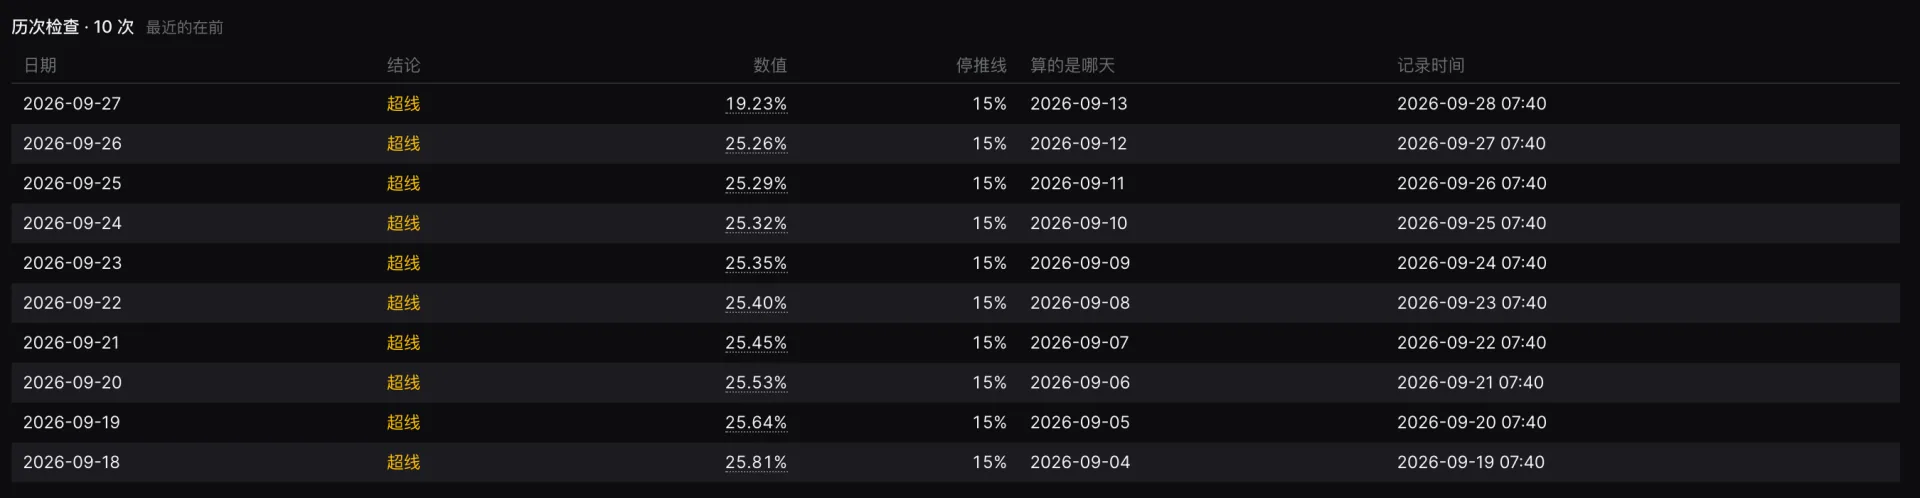
The same trap inside the product (demo data): the humidifier's row total reads 6.58%, while its 14–19 Sep pay dates sit at 20–24%. Four of them are outlined as over the line, and the product is already on alert. A blank cell means no orders that day (a delisted product, for example), not 0%.

Where a refund happens decides what it tells you

Vigil sorts every completed refund into one of three stages by the shipping status at the moment the buyer asked for it. What counts is how far the goods had travelled, whatever the after-sales type: a refund-only request can still come after shipping.

  1. Before shipping

    The order hadn't left yet. Mostly automatic platform refunds, and no signal about the product itself.

  2. In transit or returned

    The goods had left the warehouse but hadn't reached the buyer, or had come back.

  3. After delivery

    The buyer had the goods. The clearest signal about the product itself.

Before shippingIn transit · returnedAfter deliveryAfter-sales in progress

Return rate (after shipping)

The default for alerts

—
Counted
Counted
—

Post-delivery return rate

A sharper product-quality signal

—
—
Counted
—

Upper-bound return rate

Used for early warning

—
Counted
Counted
Estimated

All three divide by shipped sales: the amount paid minus refunds before shipping. Only completed refunds count as money; the upper bound adds after-sales still in progress at the order's paid amount.

03 · Product tour

One board that tells the team what to stop promoting today

Vigil's scope is deliberately narrow: make the risk visible and get the warning to the people who act on it. Task management, real-time feeds and platform scraping are out of scope; data arrives once a day from each shop's own exports.

01 / 05

The verdict first, then the evidence

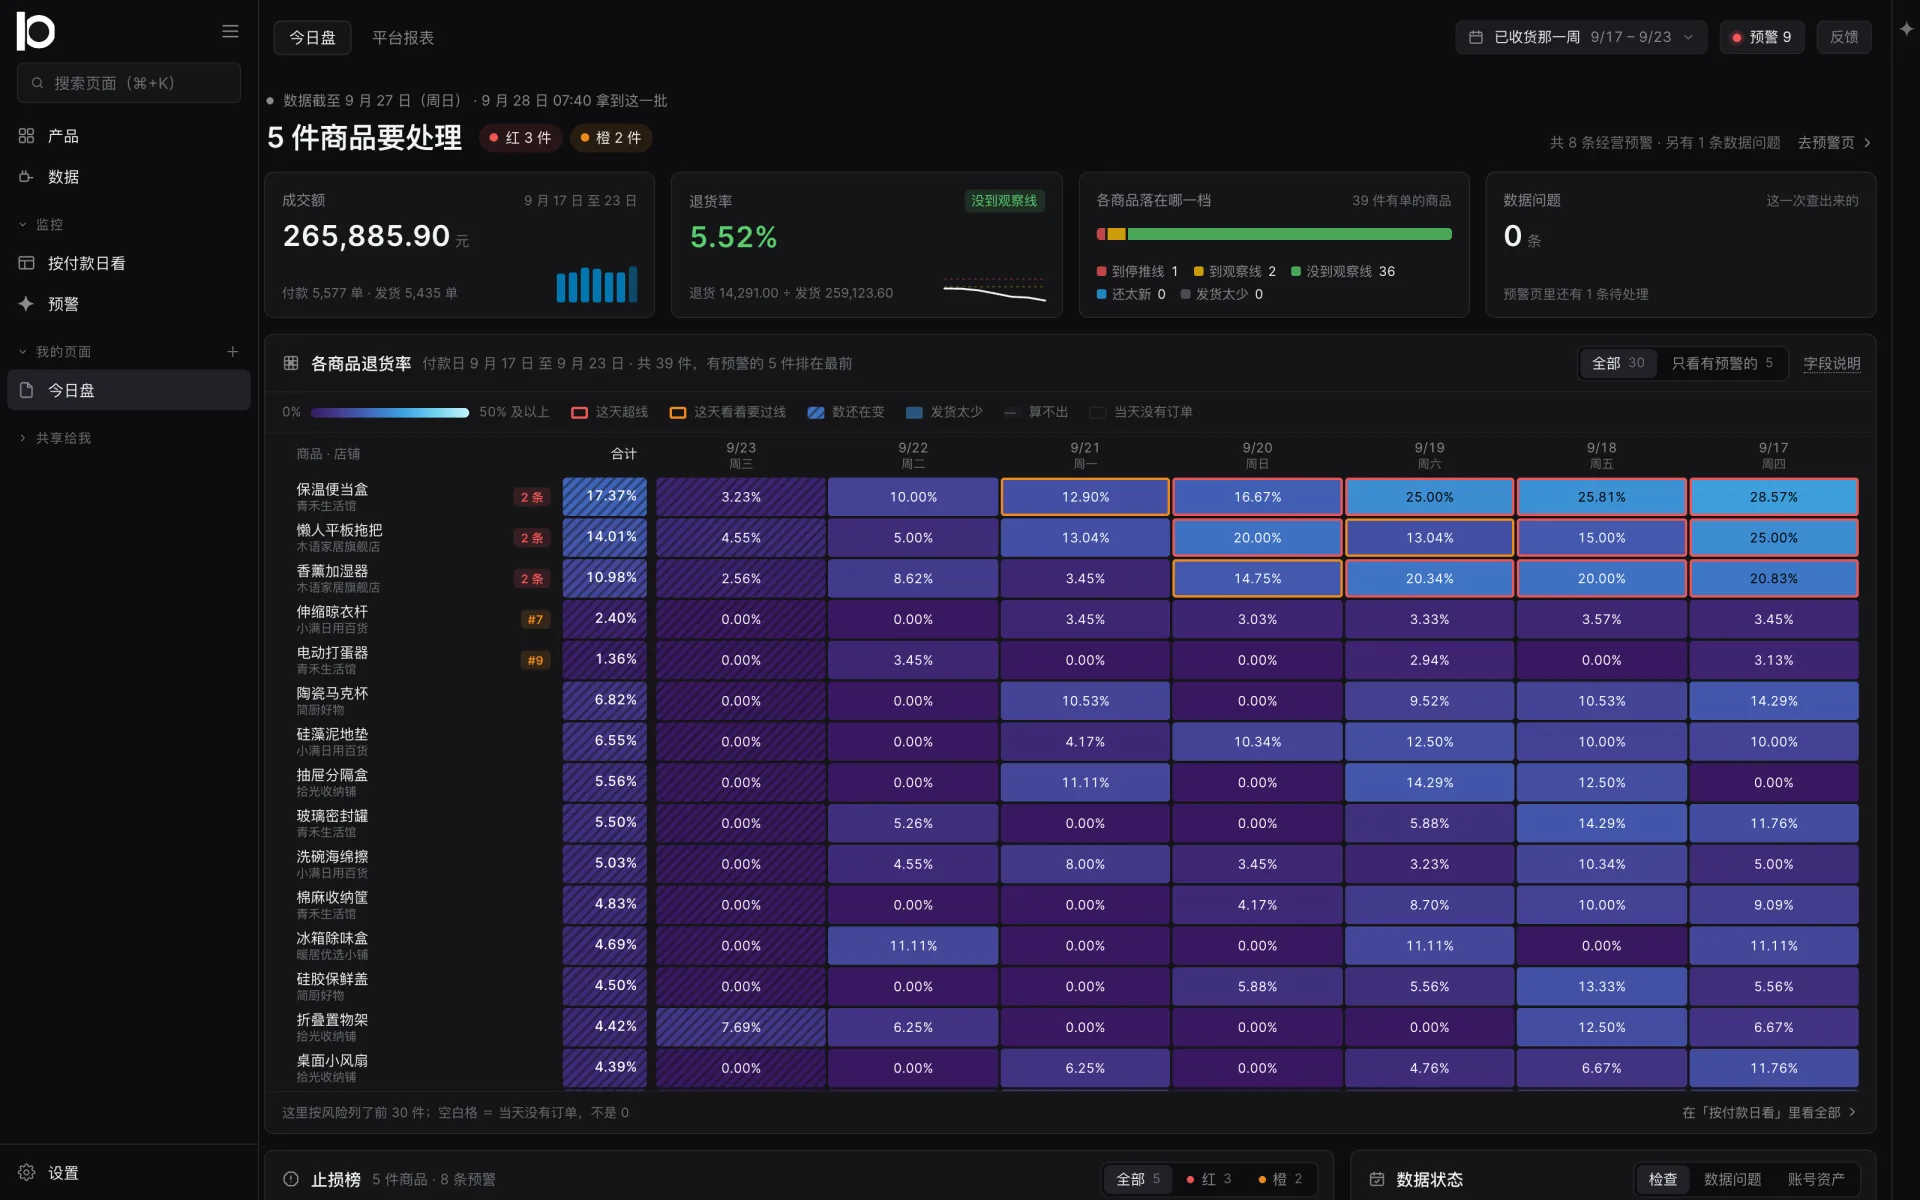
The first screen is today's verdict: how many products need action, how many red and how many orange. Below it come four overview tiles and the return-rate heatmap by pay date.

  1. Verdict firstHow many products need action, split into red and orange, ahead of any chart.
  2. Four overview tilesSales, return rate against its two lines, how products spread across risk bands, open data issues.
  3. Products × pay datesEach cell is one pay date's orders. Stripes mean the numbers are still moving.
  4. Alerts on the rowOpen alerts sit next to the product; red outlines mark the days over the line.
  5. The delivered weekOld enough for returns to show, recent enough to act on.
Demo data
Vigil's Today board with its verdict line, four overview tiles and the return-rate heatmap.

Warning before the line is crossed

Returns take around ten days after payment to mostly land, so waiting for the real rate to cross the line is often too late. Vigil watches three signals and opens an alert as soon as any one of them fires.

  1. Period total over the lineThe return rate over the selected period is above the stop line.
  2. One pay date over the lineAny single pay date in the window over the line, so one bad day can't be averaged away.
  3. Early signalCounts orders with an after-sales request that hasn't been refunded yet (the upper-bound rate), judged from the third day after payment.

An alert raised only by the early signal is orange. A product in a given shop keeps one alert per rule, and later days over the line are added to that same alert.

One pay date: which line crosses first

Illustrative model
  • Return rate so far
  • Upper bound (incl. after-sales in progress)
Over the 14 days after one pay date, the upper-bound rate crosses the 15% stop line on day 5 and the return rate so far on day 7; both end at 28%.0%5%10%15%20%25%30%Stop line 15%12302468101214Days since payment
  1. Day 5The upper bound crosses; an orange alert opens on the early signal
  2. Day 7The actual rate crosses; the evidence goes onto the same alert
  3. Day 14Still over the line once settled at 14 days; a red alert opens
In this illustration the warning comes 2 days before the real crossing. Illustrative model: a product that eventually returns 28%, with the same return-delay distribution as the demo dataset.

04 · Traceable

Click any number and see the orders behind it

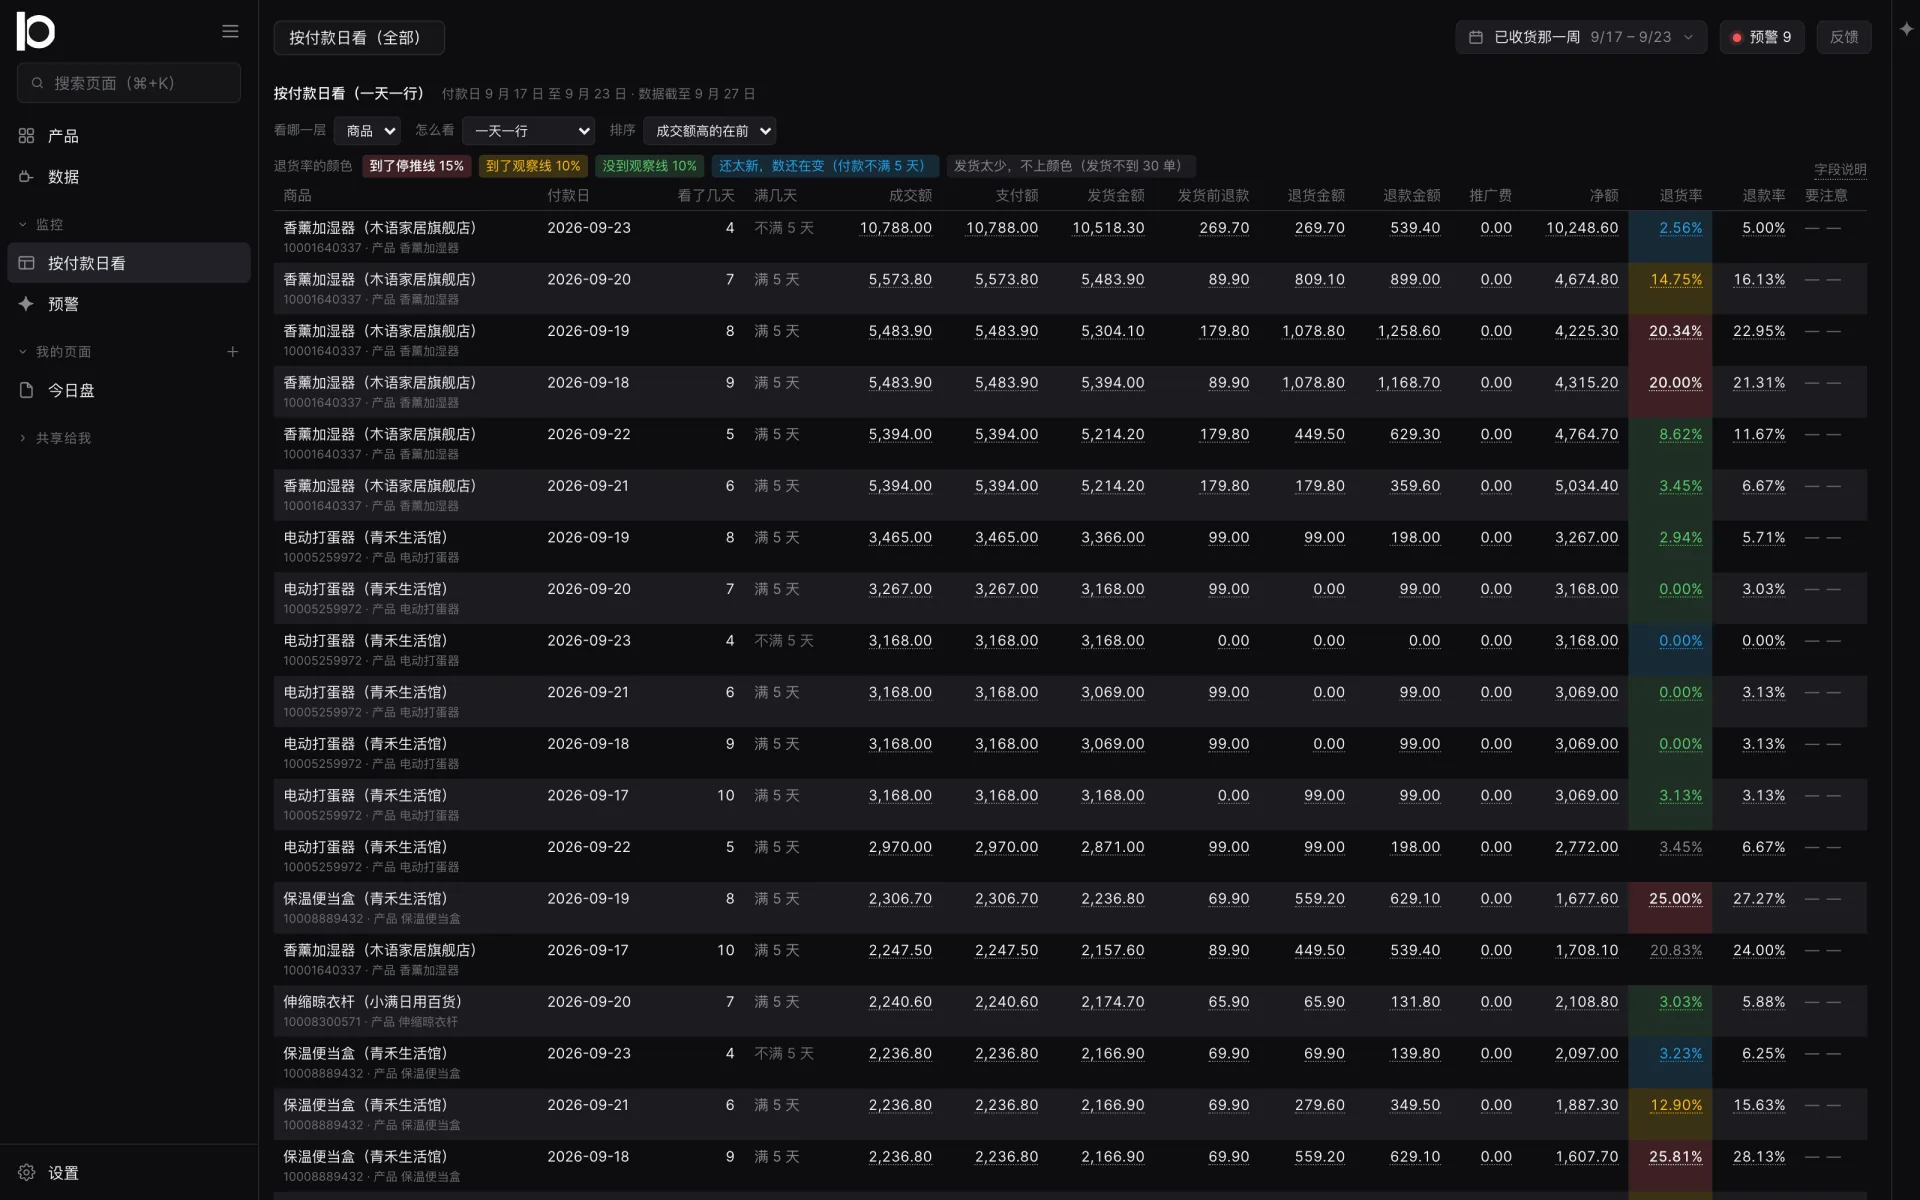
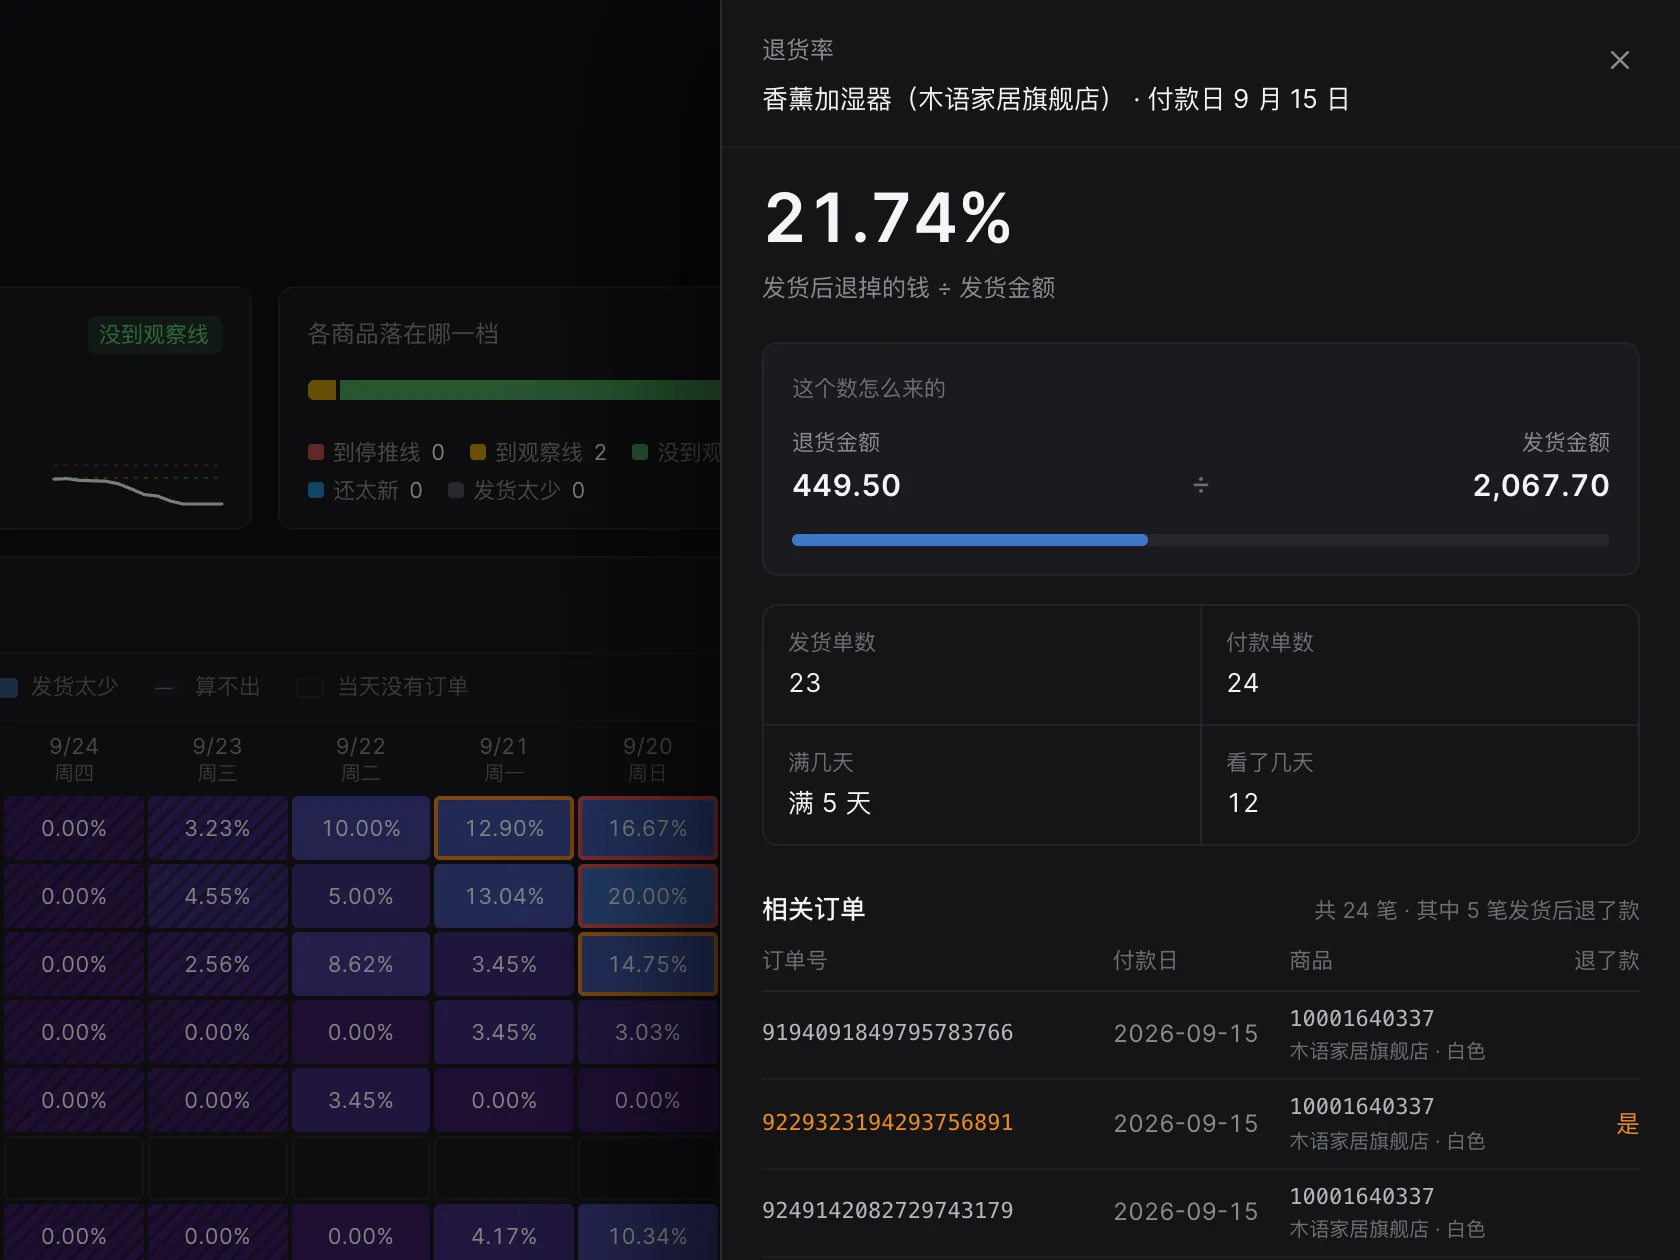
A rule from day one: no number on screen that can't be opened. The drawer first explains the number in plain words, then shows its numerator and denominator side by side and lists every order behind it. The formula and its version sit in a folded technical-details block for anyone who needs to check.

Demo data
Demo: the cursor rests on a product's 6.58% row total, slides to one pay date at 21.74% and opens the drill-down drawer listing the 24 orders behind it.

Demo data: from a row total down to the orders.

  1. Row total 6.58%
  2. 15 Sep pay date: 21.74%
  3. The 24 orders behind it

Every column explained

Every table explains its columns in plain language. Internal IDs and rule codes never reach the screen; a guard test fails if one slips in.

The field guide panel explaining each column of the heatmap in plain language.Demo data

Every number says how settled it is

Returns keep arriving, so the most recent days always read low. The usual workaround is to leave the last few days out. Vigil keeps every number on screen and labels each pay date with how long it has been observed and how settled it is.

  • Not settledunder 5 days

    Striped on the heatmap; the number will still move a lot. At this stage it only feeds the early signal.

  • Mostly settled5–13 days

    Most returns are in; over the line is enough for an orange alert.

  • Settled14+ days

    Returns have essentially landed; over the line means a red alert.

One pay date, the return rate seen on each day

Illustrative model
0.0%
0.0%
0.0%
0.5%
2.1%
4.8%
8.2%
11.6%
14.5%
16.9%
19.0%
20.4%
21.0%
21.0%
21.0%
21.0%
21.0%

Days since payment

Slide along the strip to read each day

Illustrative model: a final return rate of 21%, the same product as the dilution chart above. The day thresholds are adjustable parameters, versioned with the parameter set; unsettled pay dates stay out of trend baselines.

05 · AI layer

An AI colleague that can't make up a number

The usual failure of AI assistants on business data is numbers that look right but aren't. Vigil flips it: the rules keep the numbers, the model does the talking. The model can only fetch data through the same read-only queries as the board, every number it writes must name the lookup it came from, and code checks each one before the answer is shown.

Demo data
Vigil's Today board: the cursor rests on the humidifier's 6.58% row total, moves to Copilot on the right and types the question; the lookup steps tick off one by one, the answer appears with a green check on every number, and hovering one shows its source.
Recorded in the app · demo data: a replay of one real run, with the waits compressed 2.5×.

Ask what the board can't answer

The first three are the sample questions the panel was designed with, which until now only answered “not available yet”. The fourth is the dilution trap from above.

01 / 04

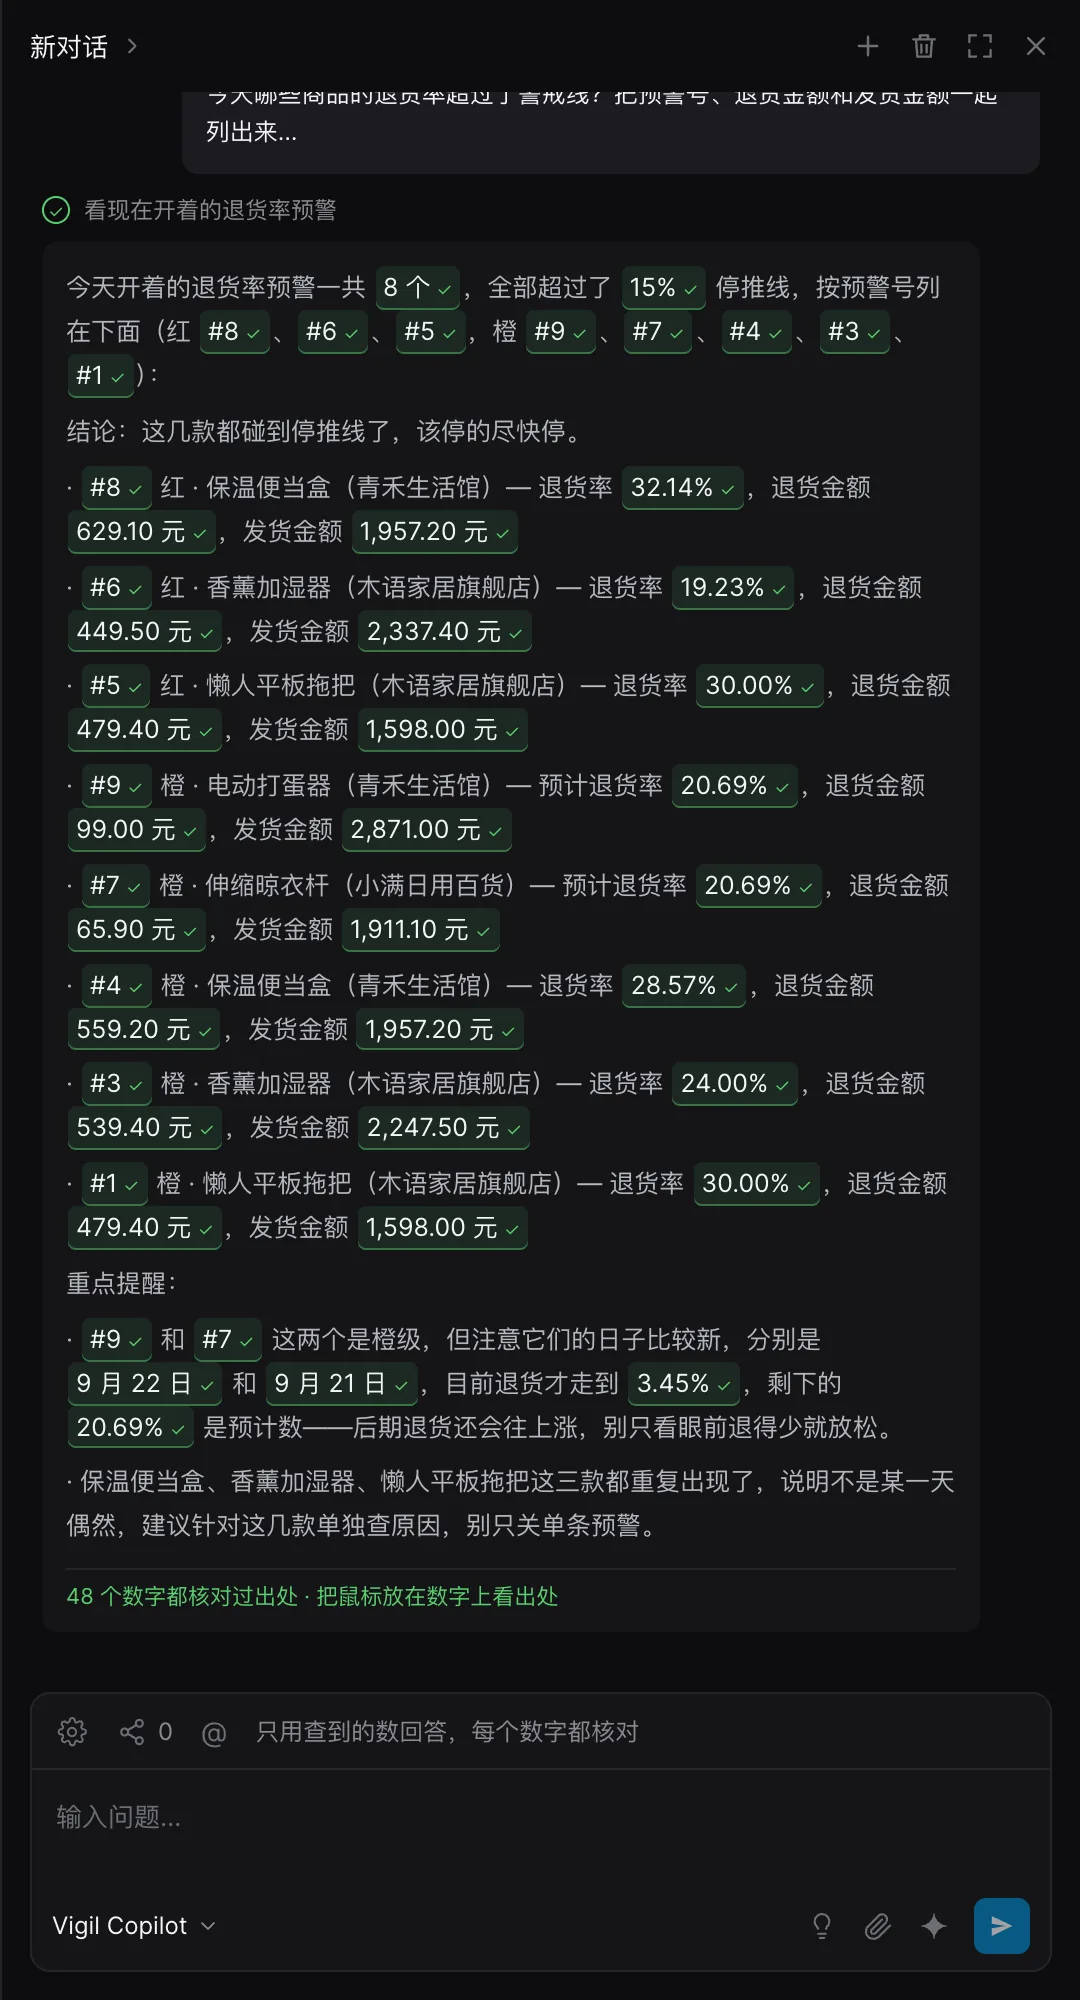
“Which products are over the line on return rate today? List the alert numbers with the refunded and shipped amounts…”

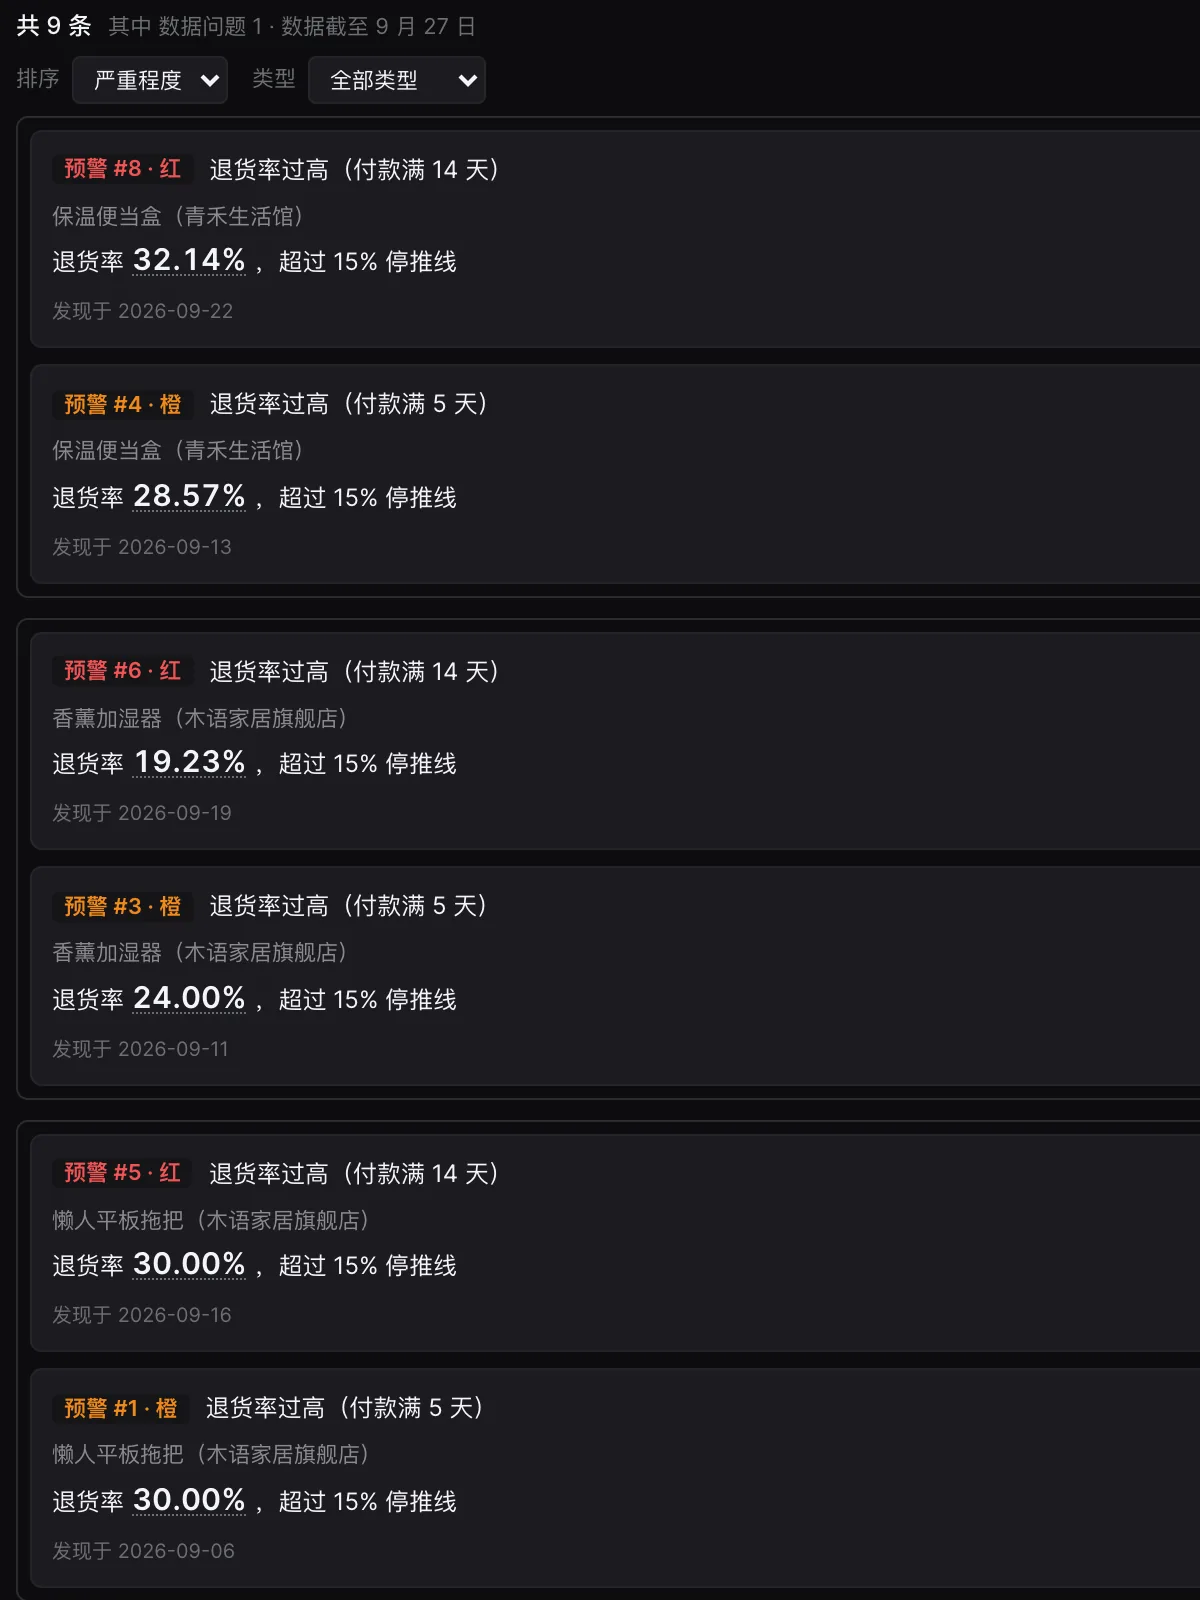
All 8 alerts, one by one, 48 numbers, each with its source. Its first draft counted the reds and oranges itself and got it wrong; the checker blocked it, and the revision lists the alert numbers instead.

1 lookup · 48 numbers checked · 3 model calls · US$0.0085 · 11.7 s

Demo data
Vigil Copilot panel (demo data): the 8 open alerts listed by alert number, every number checked.

Checked before it's shown

The checker guarantees that every number comes from a query result; it doesn't judge whether each sentence reasons well. That's why actions like stopping a promotion or closing an alert stay with a person.

  1. Queries, not SQL

    The model can only call the board's own read-only queries. Each result carries a reference number, and every figure in it is already computed.

  2. Every number names its source

    Numbers in an answer are written as value + reference. A single number outside a reference fails the whole answer.

  3. Code checks every value

    The checker isn't a model but a piece of code: it looks for each value in the result it cites. Only a passing answer is shown; a failing one goes back to the model with one chance to fix it.

Two catches, checked number by number

Demo data · real run

Numbers in the first draft

  • 3.03%
  • 32.14%
  • 77
  • 69

✕ “69” isn't in any query result: the model added the 40 and the 29 itself and still cited a source. The whole draft goes back, with one chance to fix it.

The revised draft

  • 3.03%
  • 32.14%
  • 77
  • 40
  • 29

✓ The revision lists 40 and 29 separately. Every number matches, and only then is the answer shown.

Numbers in the query results

  • By pay date · 6 Sep return rate3.03%
  • By pay date · 7 Sep return rate32.14%
  • Last 14 days · after-sales requests filed after shipping77
  • of which · quality problems40
  • of which · damaged on arrival29

Tap or click a number to see which row it matches. The checker is code, not a model: it looks for each value in the result it cites.

A case note the moment an alert opens

One per alerted product: what it looks like, the evidence, what a person should do. The evidence is gathered in one go and the model is called once; the demo dataset's seeded story for each product is hidden from the model and only used afterwards to score it.

#8 · Insulated lunch box

One bad batchDemo data

From around 7 Sep this product's returns suddenly got worse. It isn't always high; it looks more like one batch went bad.

Evidence

  • On 6 Sep the return rate was only 3.03%; on 7 Sep it was 32.14%, and for many days after it stayed around 28.13% to 31.03%.
  • Of the after-sales requests in the last 14 days, 77 were filed after shipping, including 40 for quality problems and 29 for goods damaged on arrival…

Suggestion

Hold off on scaling up, and first check whether the batch shipped around 6 Sep has quality problems or damaged packaging…

Sources checked · DeepSeek V4 Pro · open weights · translated from the Chinese original

AlertProductSeeded storyModel's callCheck
#5Flat mopAlways highAlways highSources checked
#6Aroma humidifierDiluted by growthAlways highSources checked
#7Telescopic drying poleEarly signalEarly signalSources checked
#8Insulated lunch boxOne bad batchOne bad batchSources checked
#9Electric whiskEarly signalEarly signalSources checked

Right on 4 of 5. All 5 notes passed the check in the end, 90 cited numbers in total, at US$0.0012–0.0090 per note.

The miss is the dilution trap. This product's returns have always run around 21%; “dilution” describes how the board total hides that, not a different kind of change in the product. The model's “always high” is in fact true of the product. The fix belongs in the question, not in pushing the model toward the answer we wanted.

On an open-weights model

The lab runs DeepSeek V4 Pro through OpenRouter. From the first debug call to the last recorded run it made 27 model calls, US$0.0723 in total, with a median of 4.7 s per call. The tools don't depend on the model: in production it could be swapped for one deployed in-country.

  • US$0.0723total model spend for the lab
  • 27model calls
  • 4.7 smedian call
  • 166numbers cited and checked one by one

What each of the four questions took

  • What's over the lineUS$0.0085
  • Unmatched refundsUS$0.0011
  • Reading the tableUS$0.0024
  • The dilution trapUS$0.0068

Tap or click a row to see all of that question's readings

The four questions took 10 model calls, US$0.0189 in total. Model: DeepSeek V4 Pro · open weights.

Why Vigil is the right base

The AI layer holds up because the foundation had already done the hardest part.

What Vigil already hasWhat it gives the AI layer
One metrics module, 52 machine-readable definitionsThe model's vocabulary: no invented formulas
Every number opens to its ordersThe model's citations: sources that go all the way down to orders
Every pay date labeled with how long it has been watched and how settled it isNo treating still-rising numbers as final
Alerts as cases, evidence appended dailyThe model's memory and case file
A plain-language layer and a jargon guardThe same yardstick for grading answers
Versioned threshold setsLine changes that can be proposed, backtested, signed and rolled back
No arithmetic allowed in query SQLThe model can quote numbers, never compute them
Seeded stories in the synthetic demo datasetAn eval set with known answers

A day with AI-native Vigil

02 / 07

08:05

Running

Someone asks Copilot: “The humidifier is only at 6.58%. Is it fine?” It points out that new orders are dragging the total down.

  • Live
  • Running · demo data
  • Next

If we kept building

Eight layers, each built on something Vigil already has. The first two already run on the demo dataset.

01 / 08

Ask

Running · recorded in the app
What people see
Ask in plain words; it looks things up and cites every number
What it builds on
Read-only queries, the metric registry
Vigil's Today board with the Copilot panel on the right (demo data).

The loop above is this layer: the question, the lookup steps, the checked answer.

06 · Architecture

A small system with hard edges

One codebase, two containers and a database. Raw exports are append-only and never edited, so every layer downstream can be rebuilt from them.

Ingest

  1. Shop exportsdaily, via the client's RPA
  2. Acquisitionquiet-period check · SHA-256 · append-only ledger
  3. Raw zoneimmutable files
  4. Canonical layerparsed by header signature · no buyer data

Compute & alert

  1. Metrics modulepure TypeScript · golden tests
  2. Derived layercohorts · daily aggregates · evaluations
  3. Alert casesone per product × rule
  4. Ops group pushafter commit · by case state

Serve

  1. Board & drill-downevery number → its orders

Next phase (designed)

  • Case close-outacknowledge · dispose · escalate
  • Off-site backupsdatabase and raw zone
  • Heartbeat sentineldaily run, backups, disk
  • CI & image registryimages shipped by hand for now
Built and runningDesigned, staged for the next phase

The metric definitions

Every metric is defined once, in a single metrics module, with a version and a plain-language description. The formula behind any number on screen is this same definition.

01 / 08

Sales received

received basis
What it is
What the shop actually received on paid orders, by pay date; matches the sales figure in the platform's own back office.
Formula
Σ amount received on paid orders
What it's for
The base for amounts and profit

Six decisions that shaped it

  1. Alerts are cases

    An alert system is far more likely to drown in noise than to miss something. One open case per product and rule; evidence is appended daily; severity only goes up; nothing closes on its own.

  2. Formulas in code, thresholds in data

    A formula DSL was rejected. Every formula lives in one metrics module under golden tests; thresholds are versioned parameter sets, and every run records which version it used.

  3. Ratios are never added

    Period totals re-divide summed numerators and denominators. Averaging daily rates is a classic way for a dashboard to mislead.

  4. Exports identified by header signature

    Each export layout is pinned by a header signature, and an unknown layout is quarantined. Buyer names, phones and addresses never enter the canonical layer.

  5. Raw data is append-only

    Files are checksummed and never edited. Replays go through the same ingest path; nothing patches the canonical layer by hand.

  6. Push after commit, retry by state

    Messages leave only after the data is committed, and cases are picked by state. A failed send retries on the next run: at worst a repeat, never a gap.

07 · Delivery

One lead, AI agents building, live within four weeks

I owned the product definition, the architecture and every trade-off: what to build, what to leave out, how each number is computed and when it ships. AI coding agents did the implementation and testing, working throughout under a set of engineering rules I wrote.

  • 34days from first commit to delivery and archive
  • 244commits
  • 25architecture decision records
  • 103test files

Those rules included

  1. A ten-point charter

    Hard constraints written before the build; every change had to obey them.

  2. Decision records first

    Changing a settled decision meant writing the record before touching the code.

  3. Lessons become rules

    Every mistake went into a lessons file; when a root cause came back, it became a hard rule.

  4. Blind review, real guard tests

    Changes to how numbers are computed passed blind review by independent models before my sign-off, and a guard test only counted if it failed with the fix reverted.

Caught before release

  1. A drill-down that didn't add up

    Two blind reviewers, unable to see each other, independently hit the same blocker: one ratio's drill-down used the wrong column as its denominator.

  2. Half a batch taken as a whole

    The data hadn't all arrived, yet the code carried on computing, so shops still uploading would have counted as zero sales. Now an incomplete batch rolls back and waits.

  3. File times 8 hours early

    Whether a batch was complete was judged by file times, and the unzipped files were stamped 8 hours early. The self-tests all passed; blind review caught it.

  4. A fix that brought its own bug

    One fix introduced a blocker of its own. Since then there's one more rule: every fix goes through another blind review.

One data-structure decision went through nine review rounds across three families of models. The first round raised 25 findings, 6 of them blockers, all adopted. When four rounds in a row each surfaced one new issue, the rule “stop and escalate if it doesn't converge” kicked in and a person made the call.

The Copilot lab followed the same rules: a decision record first, the guard tests updated with it, and 1,468 unit tests passing.

Built by AI agents under a set of rules; the AI colleague works under the same ones.

The full build log, covering the rules, the review loops and the mistakes that became rules, is coming to Agent Logs.

08 · Outcome

Shipped and handed over

Vigil went into production on 18 September 2026 and began pushing daily alerts to the operations group two days later. The project was delivered and archived on 24 September.

Designed for the next phase

These parts were designed and staged for later, each with the signal that would trigger it.

  • Closing the loop on alertsAcknowledgement, a typed disposition and escalation when nobody responds: the second half of the case lifecycle.
  • Off-site backupsNightly copies of the database and the raw zone to cloud storage.
  • Heartbeat sentinelAn outside watcher for the daily run, backup freshness and disk space, alerting on its own channel.
  • CI and an image registryImages are built locally and shipped by hand. Its trigger, frequent deploys, fired in the final week and was knowingly parked.
  • The AI layer: explain, ask, investigate, actAsk and investigate already run on the demo dataset. Proposed actions, drafted briefs and backtested thresholds are next, each built on the existing foundation.

Work together

If your team still finds problems in spreadsheets and group chats

I can help turn scattered data into calls your team can act on every day: first work out which numbers matter daily, how each should be computed and at what point someone has to act, then get one reliable pipeline and one board running.

  1. Pin down the problemAgree on the metrics to watch, how each is computed and the thresholds that trigger action.
  2. Ship the smallest loopOne daily pipeline and one board, running on your real data as early as possible.
  3. Add alerts and traceabilityOnce it's in use, layer on push, case tracking and drill-down.

Vigil's interface shell is built on OpenBB's open-source design system (MIT), and its look is modeled on OpenBB Workspace. OpenBB design-system